Main content
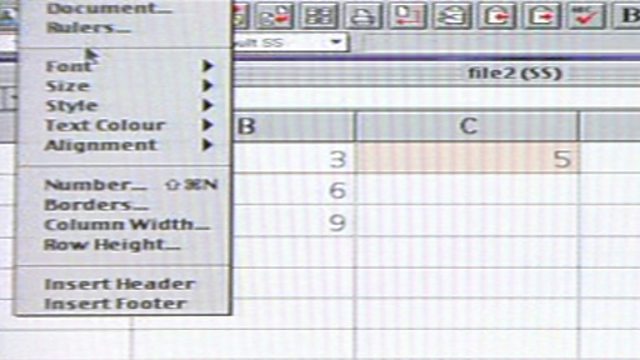
Spreadsheets - charting, altering columns and cell attributes
An explanation of how graphs and charts can be created from the information on a spreadsheet. Demonstrates how the information contained in a spreadsheet and the attributes of different cells can be altered.
Duration:
This clip is from

More clips from Bitesize: Computing Studies
-
![]()
Programming robots
Duration: 00:46
-
![]()
Computer networks - LAN and WAN
Duration: 01:13
-
![]()
How does a cashline machine work?
Duration: 00:27
-
![]()
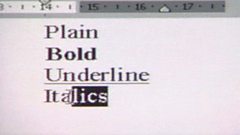
Changing the appearance of text in a word processing package
Duration: 00:36