Main content

Presenting Data - part 3
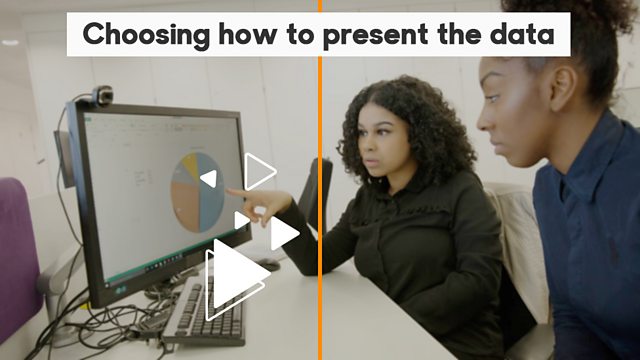
An office worker has just returned from a training session and asks her colleague to go through all the feedback forms and tally up all the results as they’re thinking of changing venues. The questionnaires include 4 possible answers to each question but she focuses on the venue question first as that is needed foremost. She first counts the number of completed questionnaires and collates the numbers to each of the 4 answers to each question and turns them into a percentage. She finally converts the percentages into a pie chart.
Duration:
This clip is from
More clips from Skillswise clips
-
![]()
Why learn about angles?
Duration: 01:02
-
![]()
Alan's story - big cash prizes
Duration: 02:01
-
![]()
Why learn to type?
Duration: 01:25
-
![]()
Neil and Denise's story - gap insurance
Duration: 02:31


