Florence Nightingale and how she visualised data
Tim Harford discusses the power of the nurse statistician’s groundbreaking diagrams with author RJ Andrews
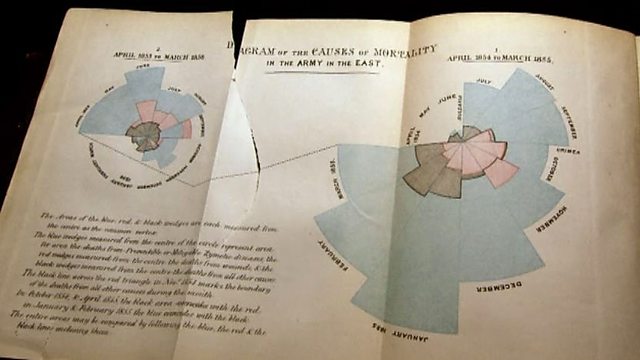
Florence Nightingale became one of the icons of Victorian Britain for her work as a nurse during the Crimean War and the public health improvements she successfully campaigned for later on. Tim Harford discusses how she and her ‘Nightingale Circle’ used spectacular diagrams to explain health statistics persuasively with RJ Andrews, editor of “Florence Nightingale, Mortality and Health Diagrams”.
Presenter: Tim Harford
Producer: Jon Bithrey
Editor: Richard Vadon
Production Co-Ordinator: Brenda Brown
Sound Engineer: Graham Puddifoot
(Diagram of 'The causes of mortality in the army in the East' 1858 by Florence Nightingale. Public domain)
Last on
More episodes
Broadcasts
 Sat 18 Feb 2023 05:50GMT��ѿ��ý World Service except Australasia
- Sat 18 Feb 2023 22:50GMT��ѿ��ý World Service Americas and the Caribbean
- Sun 19 Feb 2023 00:50GMT��ѿ��ý World Service Online, UK DAB/Freeview, News Internet & Europe and the Middle East only
- Sun 19 Feb 2023 14:50GMT��ѿ��ý World Service Australasia & News Internet only
- Sun 19 Feb 2023 22:50GMT��ѿ��ý World Service East and Southern Africa & West and Central Africa only
- Mon 20 Feb 2023 00:50GMT��ѿ��ý World Service Australasia, South Asia & East Asia only
- Mon 20 Feb 2023 10:50GMT��ѿ��ý World Service
Download this programme

Subscribe to this programme or download individual episodes.